Deal Finder
All deals · Ranked by GRM & yield
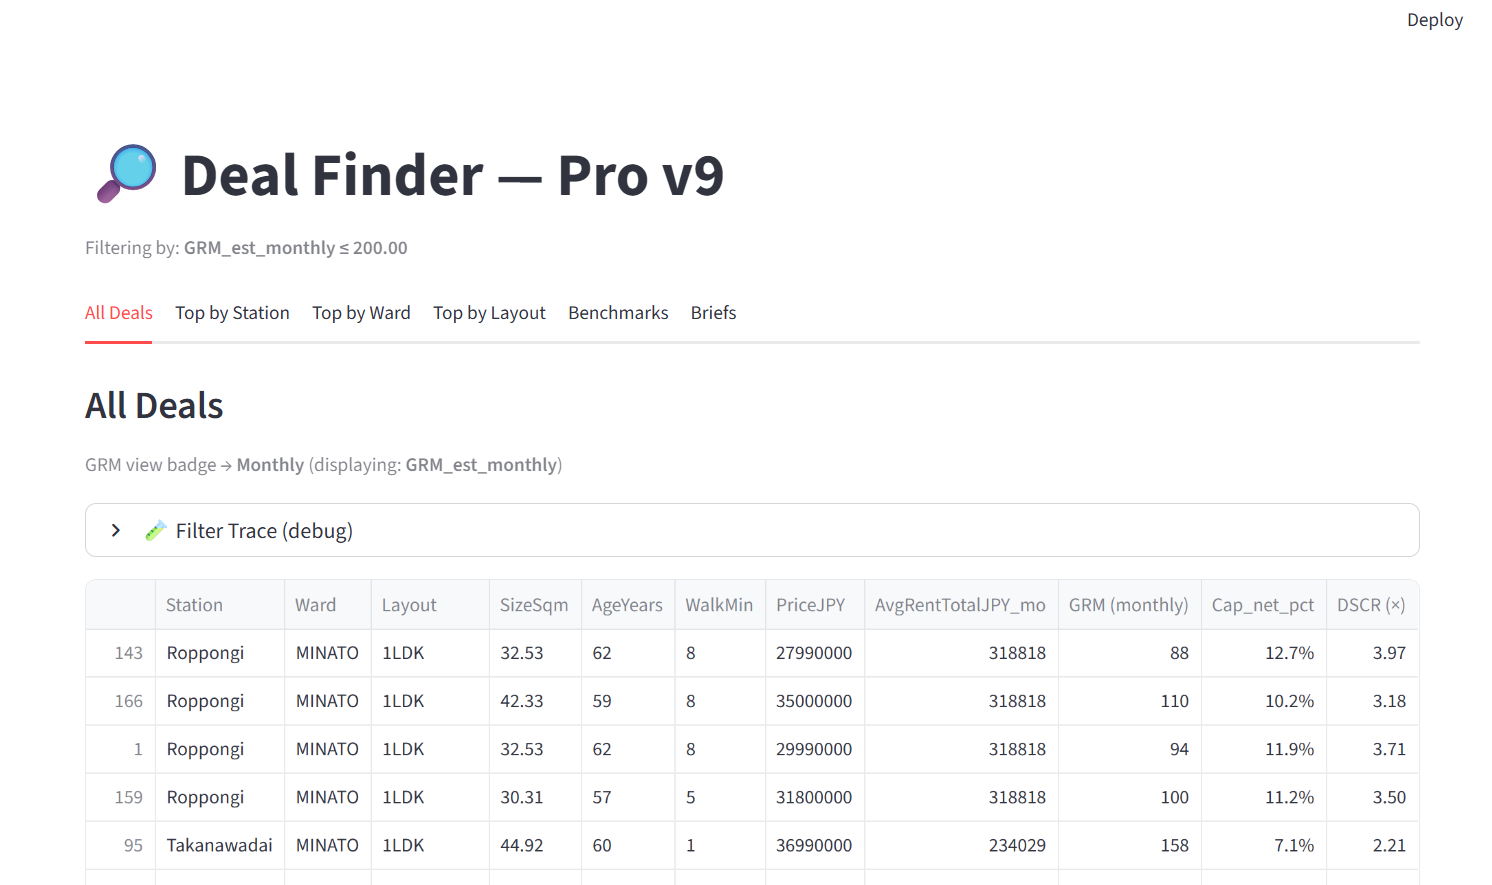
Internal screening engine used to filter, rank and compare listings by GRM, cap rate, DSCR, layout, age and walking distance to the station.
GRM monthlyCap rateStation-level
Station-level analytics, GRM benchmarks and layout-based insights used to build clear, data-backed briefs and strategies for investors in the Tokyo residential market.
Tokyo-Insights transforms the complexity of Tokyo’s real-estate market into actionable intelligence for professional investors. We analyze every station, layout, transaction, and listing to produce ultra-granular GRM benchmarks, reliable sales–rent matching, and market isochrone maps that reveal undervalued areas and real investment opportunities.
Our approach combines data-engineering, financial modeling, and deep expertise of the Japanese residential market. The result: tools that allow investors to identify arbitrage, evaluate assets in seconds, and build strategies aligned with performance constraints—yield, risk, and location.
Tokyo Insights turns raw transaction, rental and listing data into structured internal tools that support investor briefs, station comparisons and deal validation.
Internal screening engine used to filter, rank and compare listings by GRM, cap rate, DSCR, layout, age and walking distance to the station.
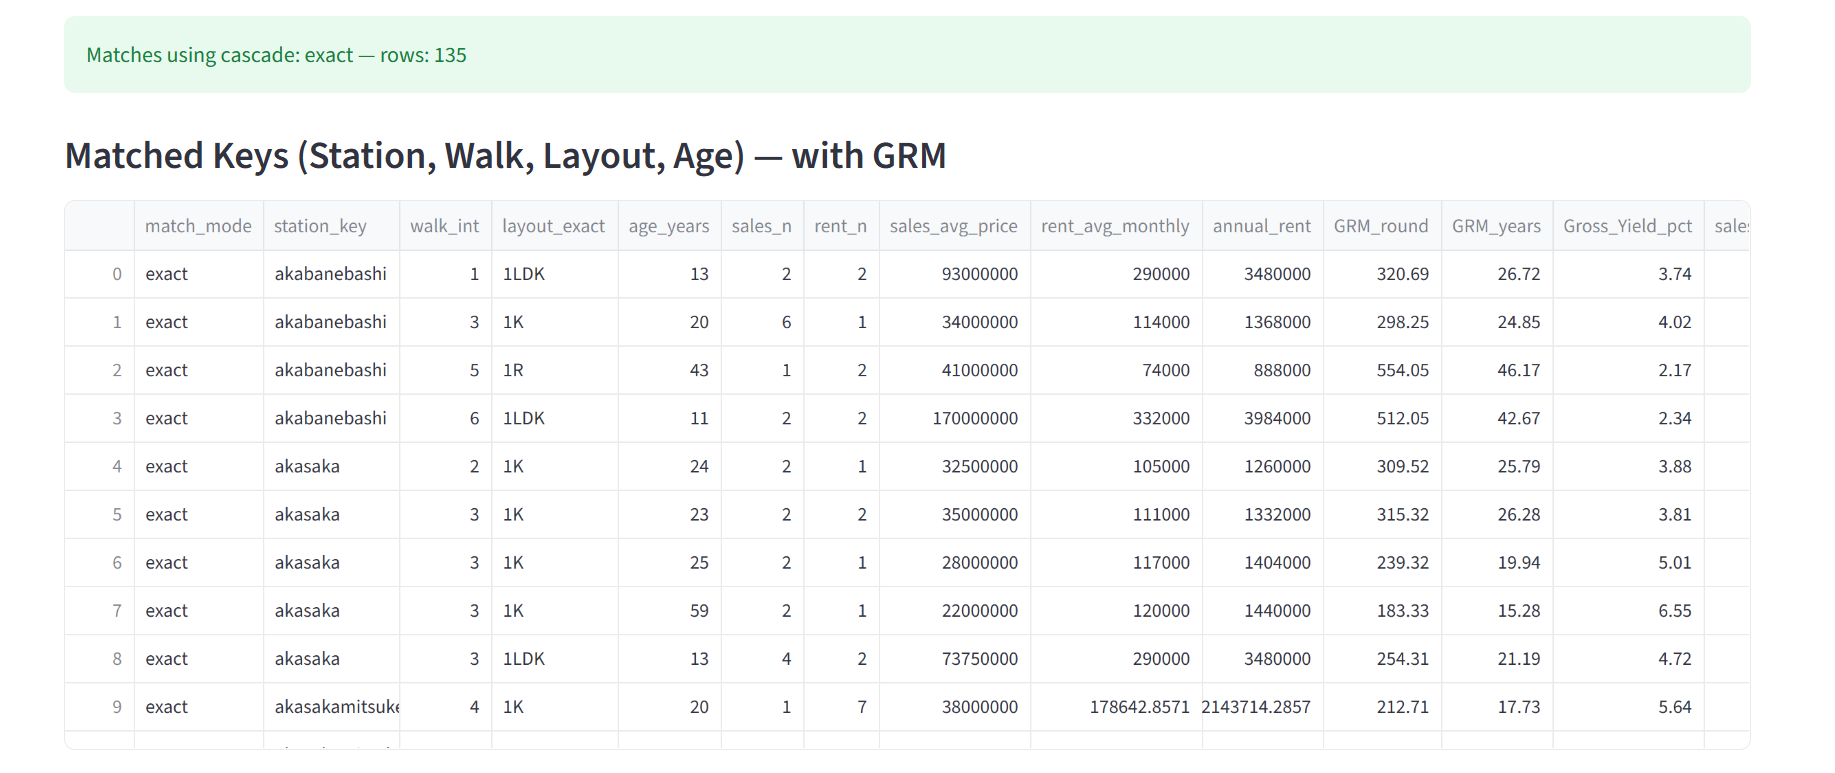
Benchmarks built by matching sales and rent data by station, walk, layout and age — the backbone of our GRM and yield analysis for investors.
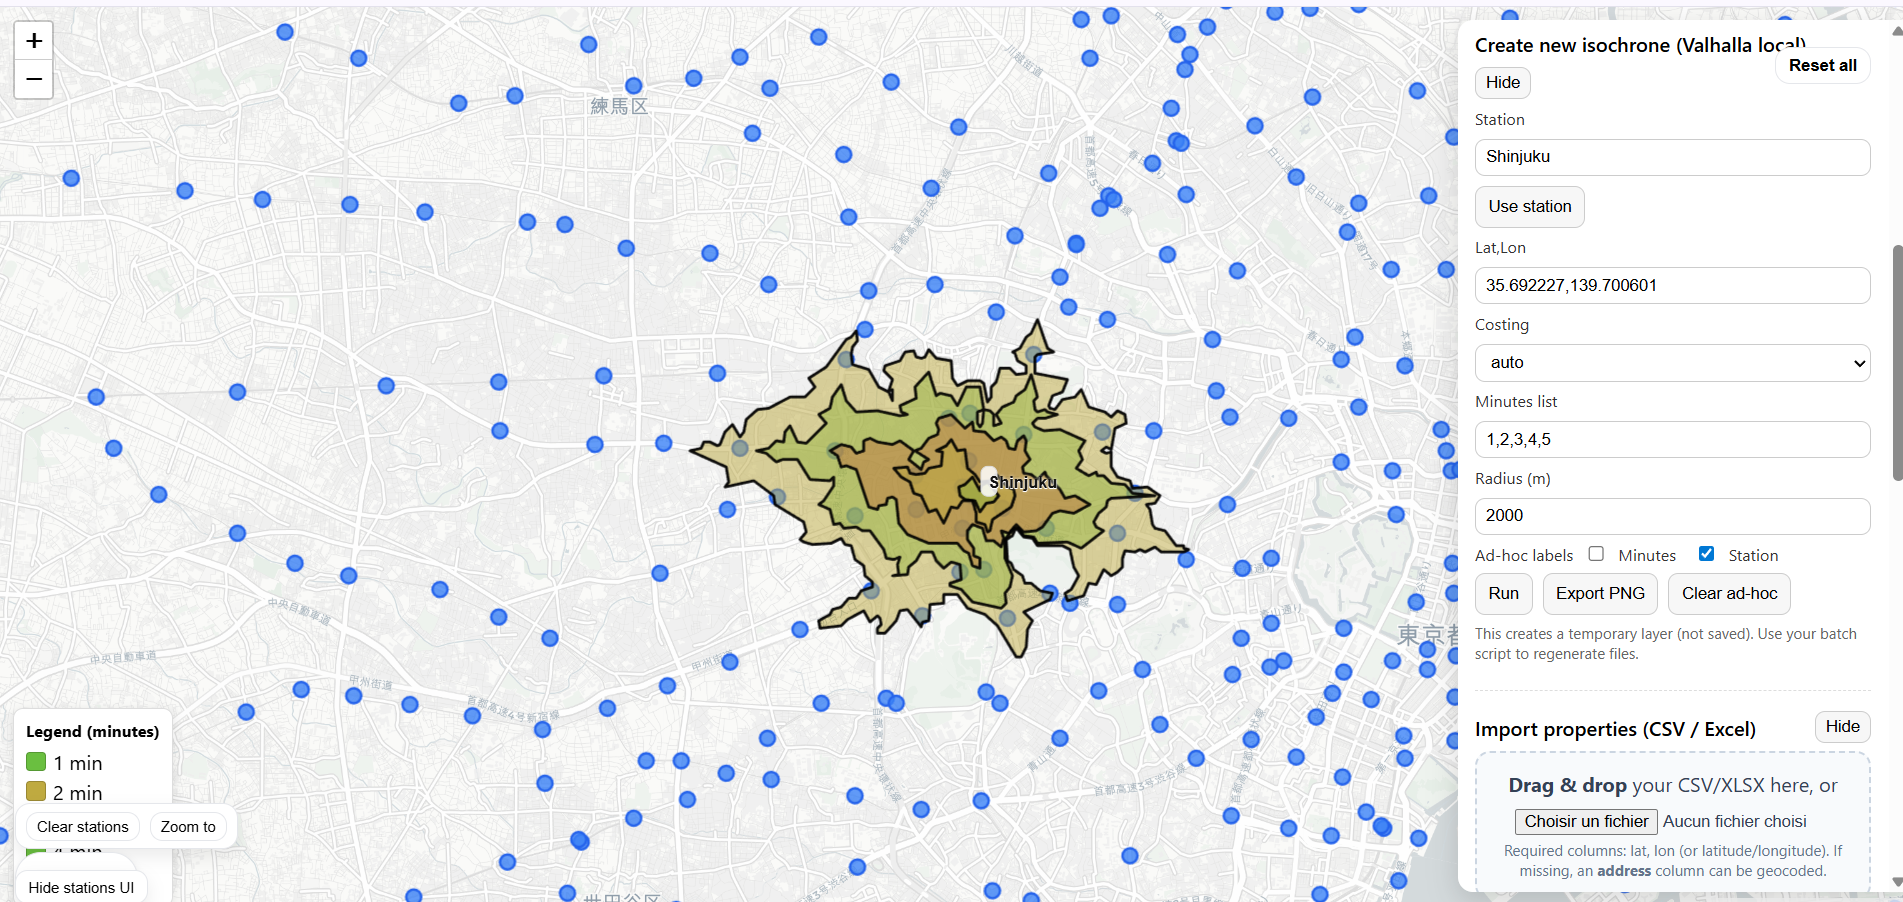
Visualisations of 1–5 minute walking isochrones around each station, used to understand catchment areas and context for specific assets and listings.
Use Tokyo Insights as your private analytics and advisory layer: from initial station screening to detailed validation of specific assets, backed by structured market data.
A premium, one-to-one service for investors and professionals who want recurring, curated insights on Tokyo's market, plus priority access to new analytical dashboards.
Long-form notes, data breakdowns and station-level spotlights documenting how Tokyo's market actually behaves over time.
A structured framework for evaluating opportunities in Tokyo by station, layout, GRM and yield, designed for serious and institutional investors.
A data-driven review of standout stations showing strong GRM, yield and walkability fundamentals for investors in 2025.
How GRM behaves across 1R, 1K, 1LDK and 2LDK stock in Tokyo, and why layout-level benchmarks matter more than ward averages.