Analytical engines powering our advisory
These tools are not commercial dashboards—they are the internal analytical systems used to produce investor briefs, validate opportunities, and understand Tokyo’s market at the station & layout level.
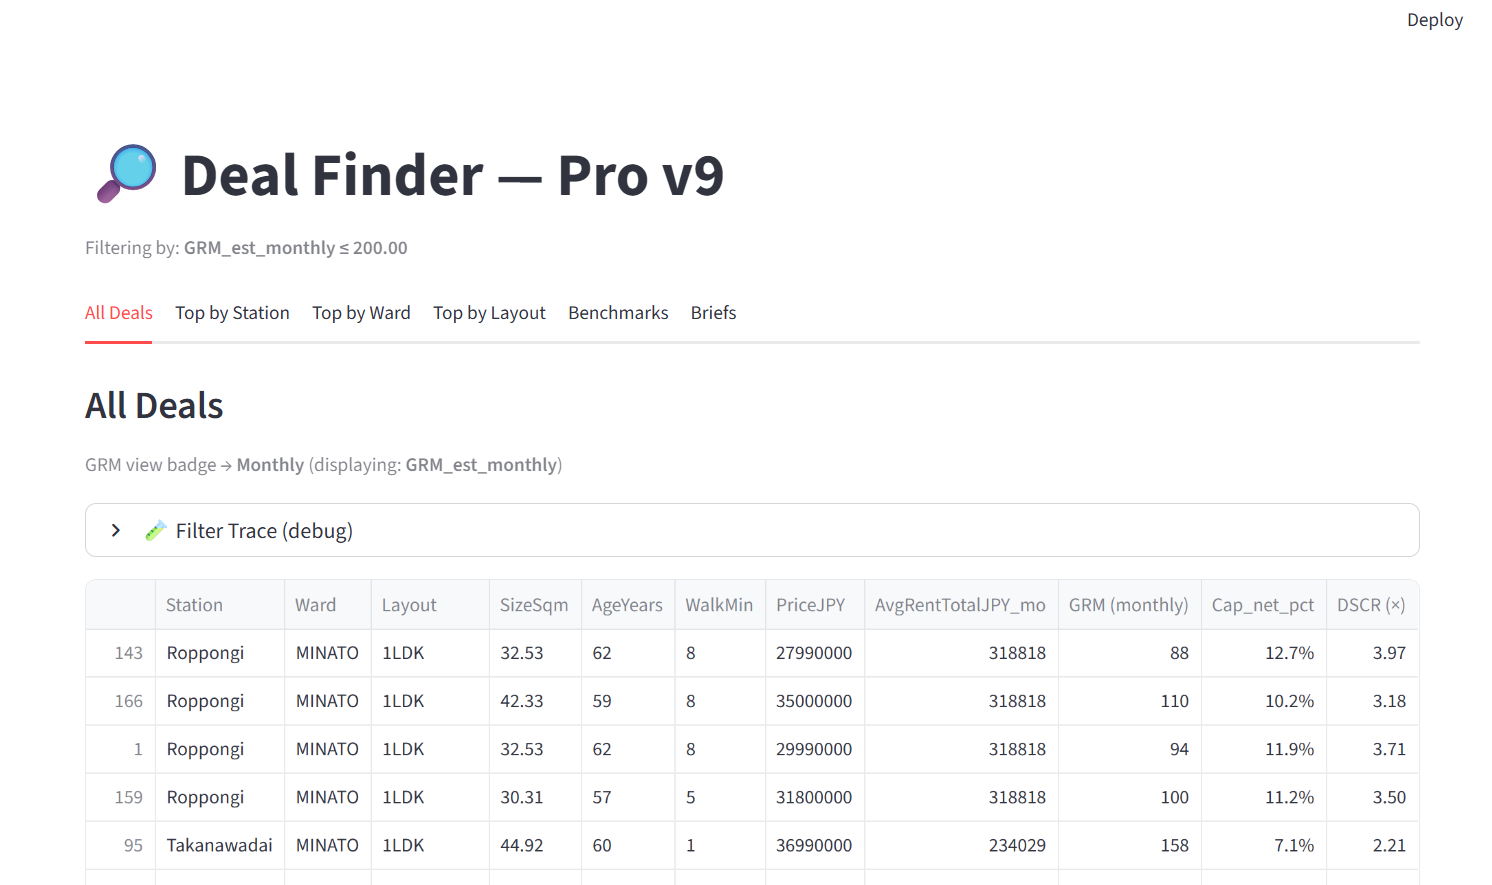
Deal Finder · Internal Engine
The ranking logic used inside Tokyo Insights to screen active listings. It evaluates GRM, yields, walk-time, layout dynamics and risk flags to support investor briefs with structured comparisons.
- Sort listings by GRM, gross yield, DSCR and layout-specific efficiency
- Identify pricing anomalies by station and walk-time
- Trace why a deal is ranked using internal logic and matched data

GRM & yield benchmarks
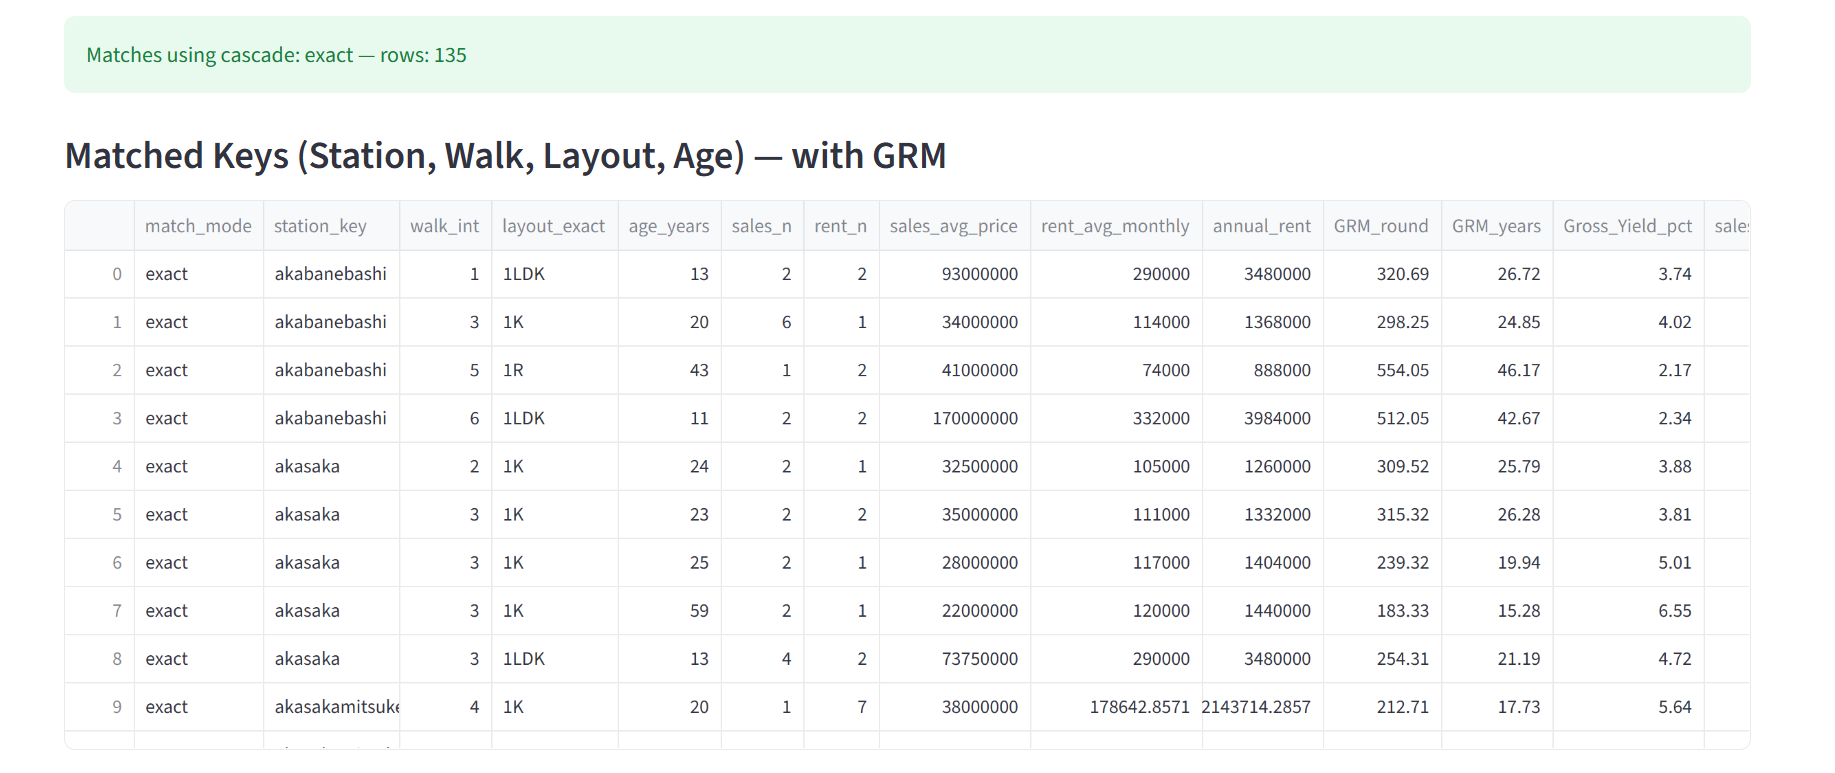
These benchmarks form the backbone of our advisory. They combine real sales and rental data matched by station, layout, walk-time and age—revealing how income streams are actually priced across Tokyo.
Matched keys
Understand how many data points support each benchmark and which layouts, stations and building ages are statistically reliable.

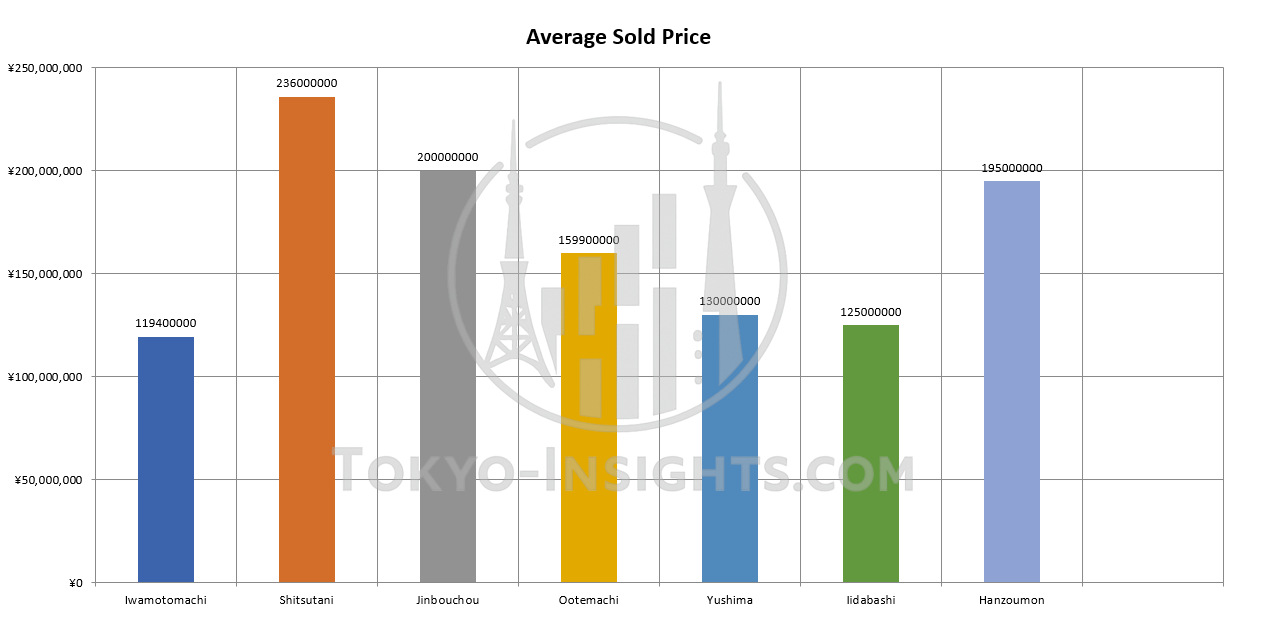
Average sold price by station
Compare stations using historical sold-price data—useful for context when evaluating whether a unit appears mispriced relative to its micro-market.

Layout & age sensitivity
See how GRM and yield shift as layout and age change within the same station—critical for understanding whether pricing is driven by fundamentals or sentiment.
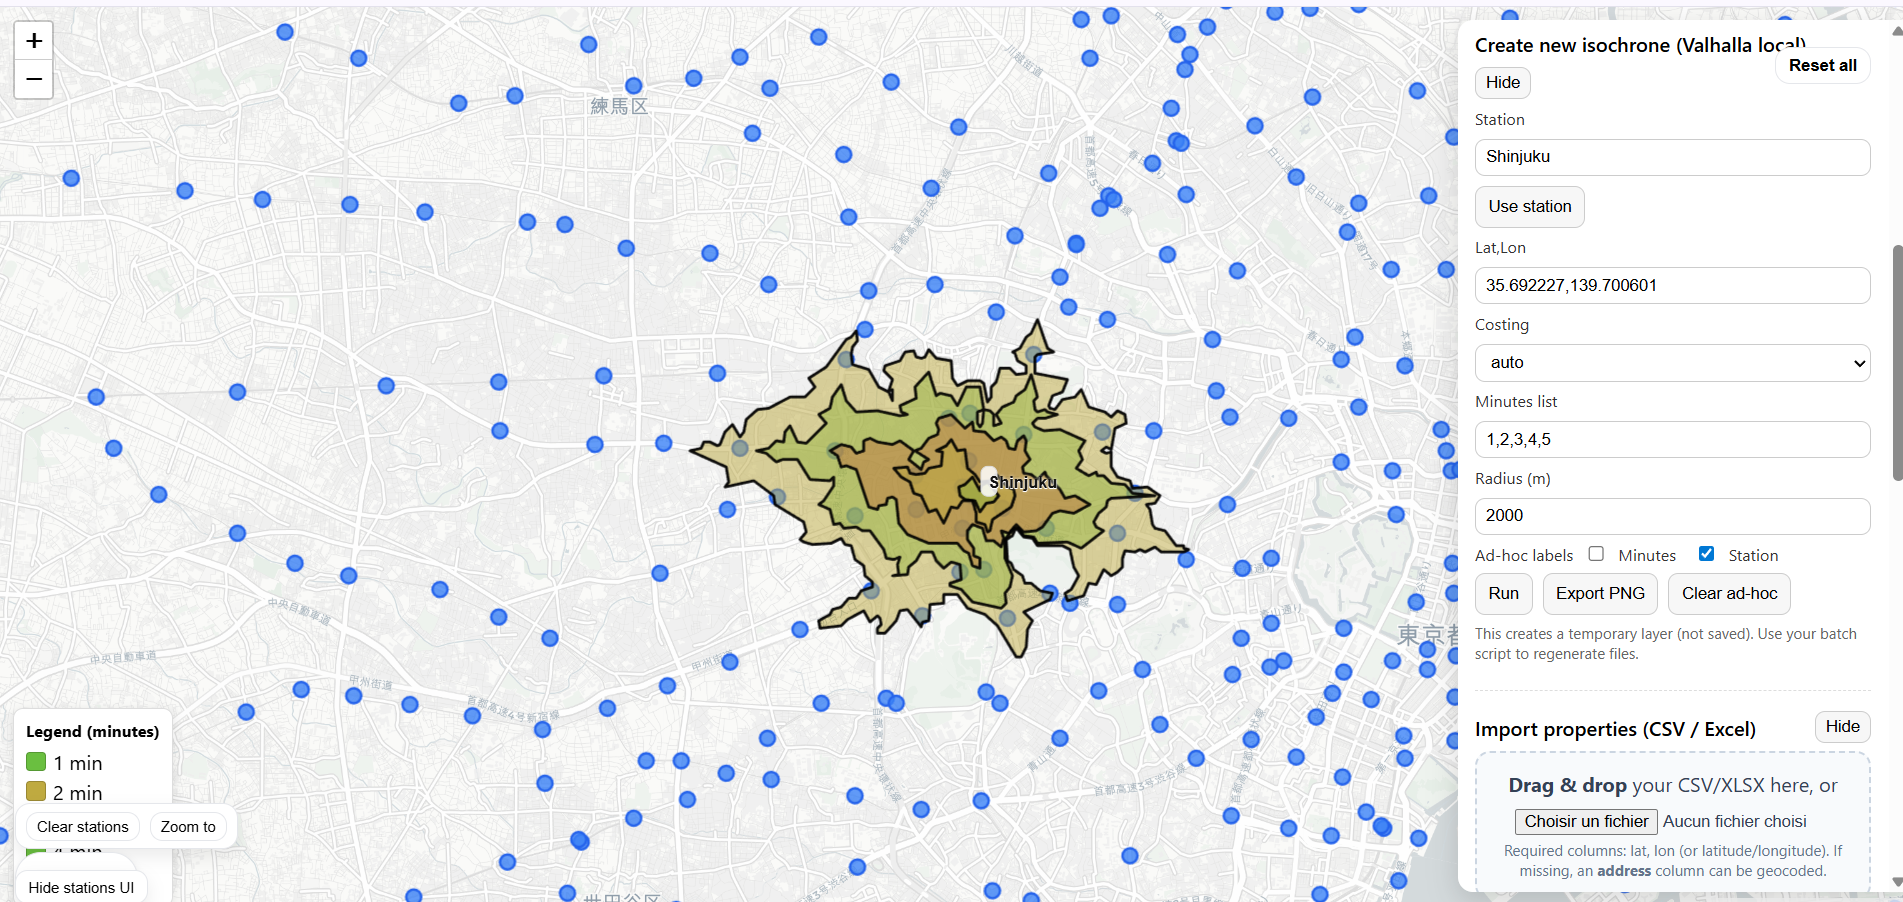
Isochrone mapping
Isochrone maps help assess the functional catchment area of a station. They are used internally to understand walkability premiums, tenant accessibility and local competitive pressure.

- 1–5 minute walking bands shown with precise polygons
- Combine with listings or address-level data for richer context
- Used for evaluating walk-time pricing anomalies
Custom analytics for specific strategies
For investors pursuing targeted strategies, Tokyo Insights can adapt internal dashboards or filters to match your acquisition criteria and risk profile.
- Focus analysis on selected wards, lines or price bands
- Incorporate custom risk flags or thresholds
- Blend your own financial assumptions with our GRM & rent frameworks