
Free station data.Just credit and link.
Four charts of Tokyo condo rents, prices and yields, station by station, from up to 153,075 listings we collect from the major Japanese portals. Take the image or the numbers for your article, report, newsletter or video.
The only condition
How to credit
- Name Tokyo Insights as the source.
- Link to this page, or to the chart's own section on it.
- Mention the licence, CC BY 4.0. Commercial use is allowed.
Each chart below has a credit line ready to paste. You can restyle or translate a chart, as long as you say that you changed it.
Rent per m² · 23 wards
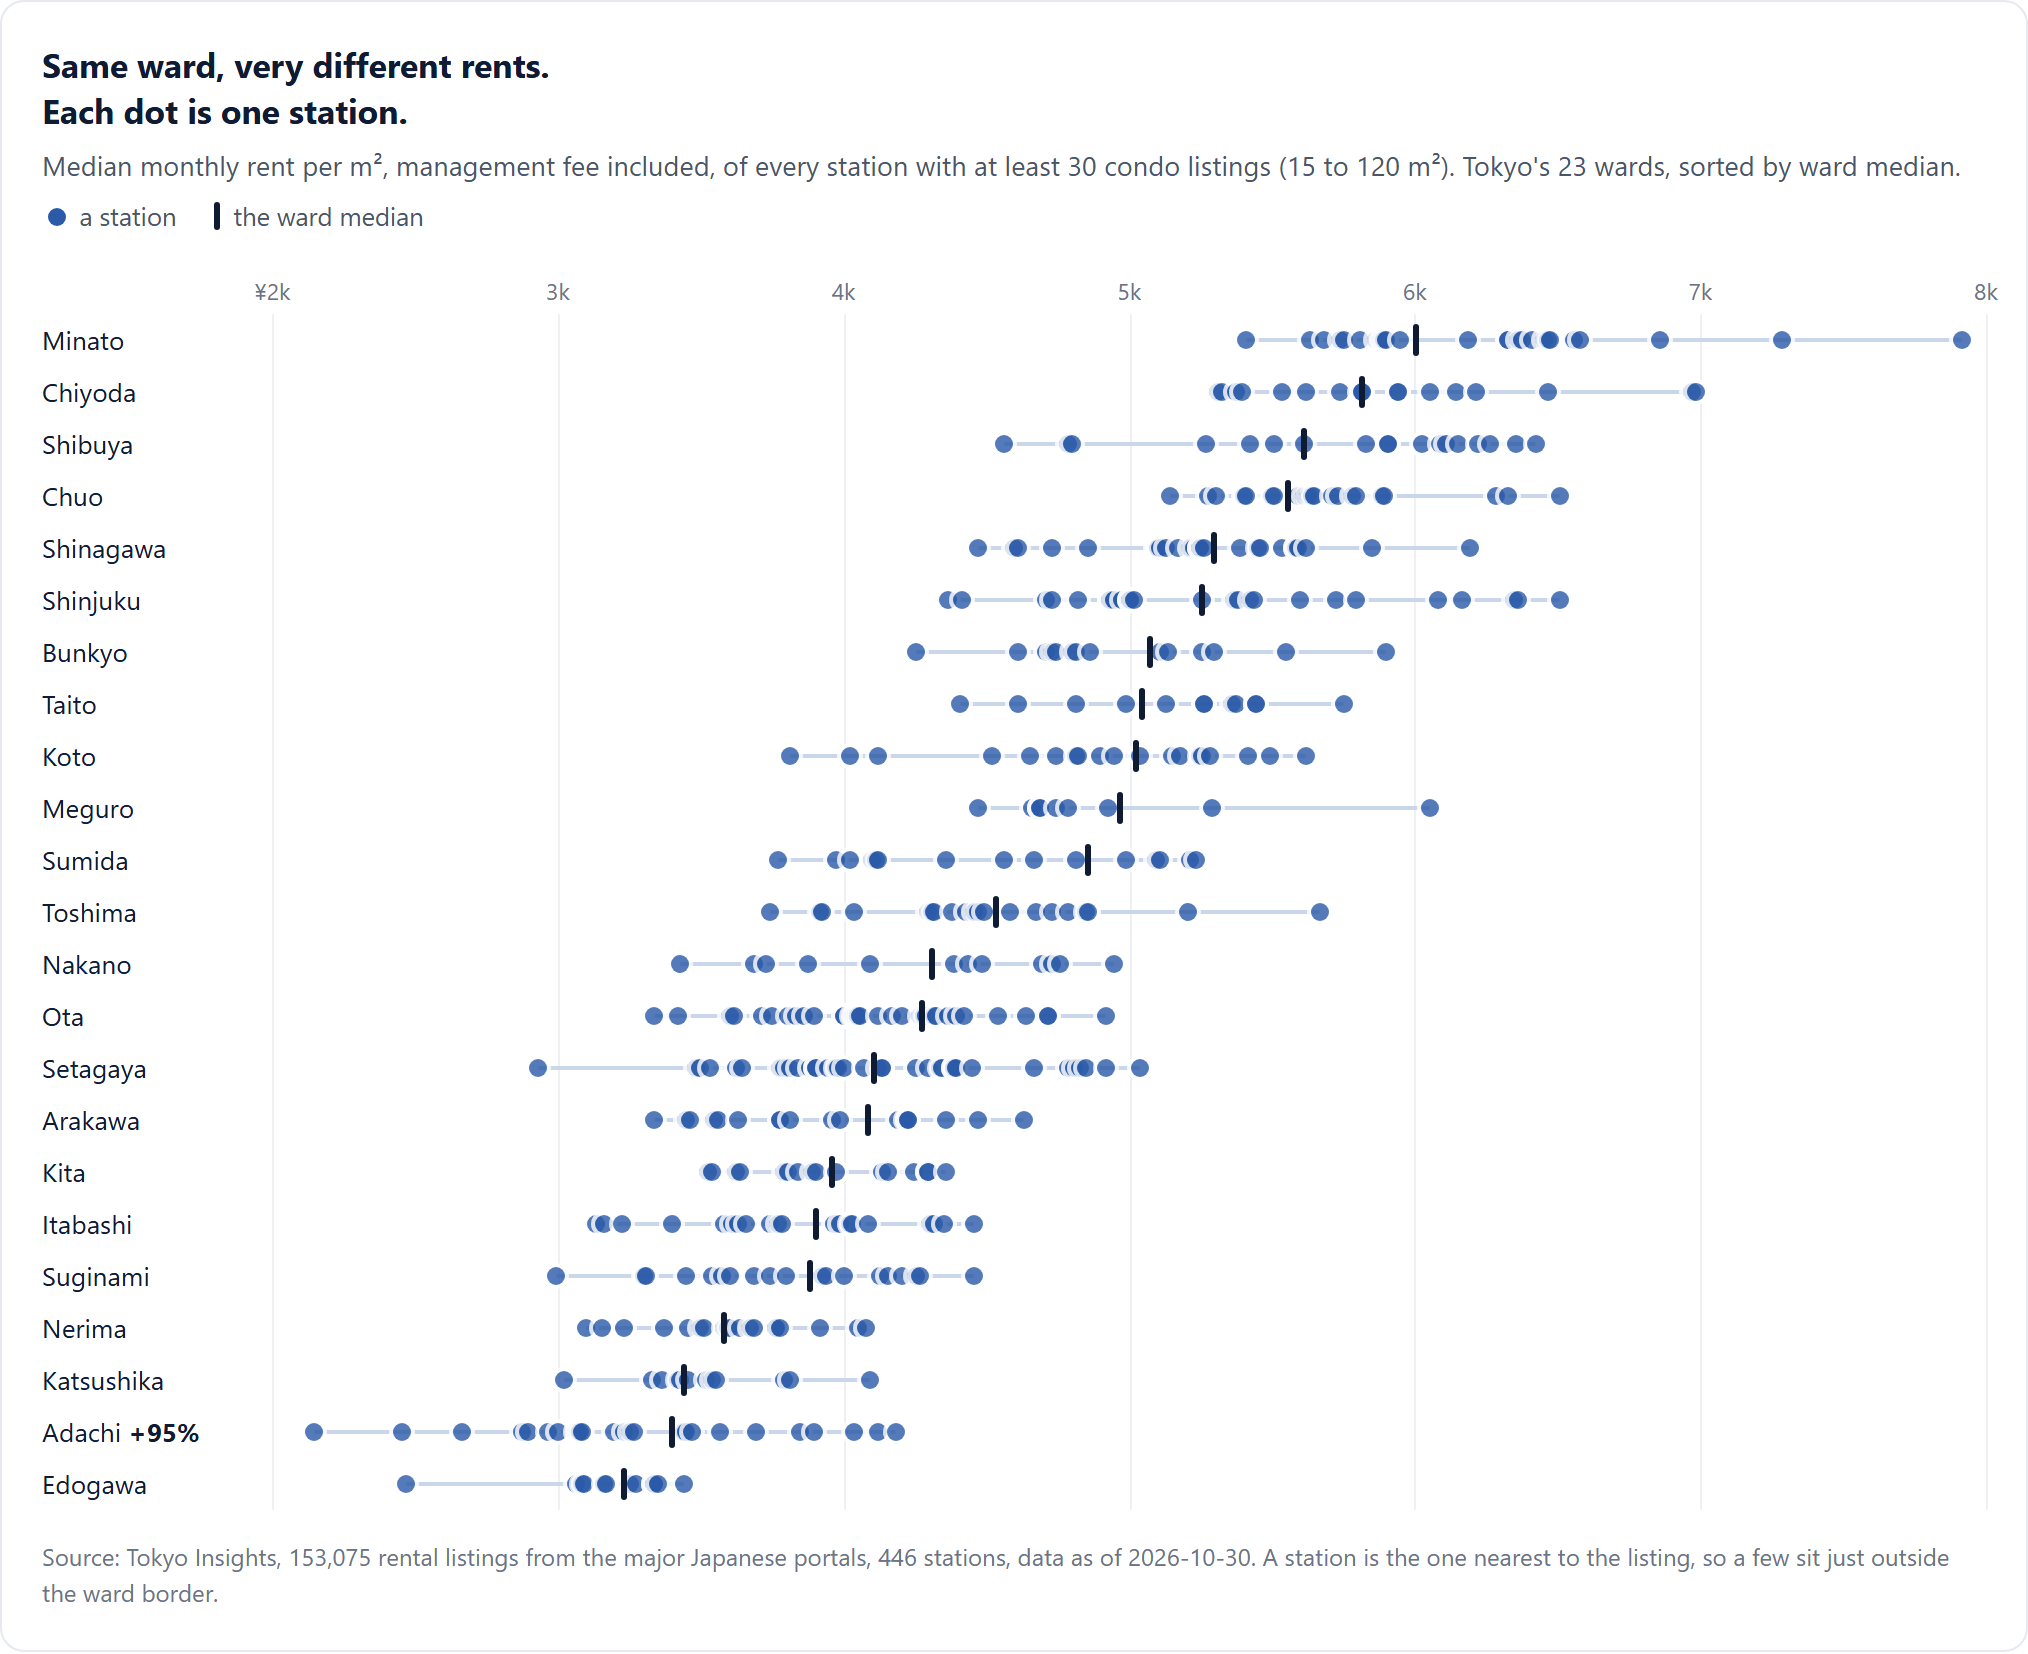
Rent per m² of every station, ward by ward
Within one ward, the rent per m² can vary by more than 70% from one station to the next. Useful for any piece that compares Tokyo neighbourhoods.
Source: Tokyo Insights, 153,075 rental listings from the major Japanese portals, 446 stations, data as of 2026-10-30. A station is the one nearest to the listing, so a few sit just outside the ward border.
See the numbers by ward
| Ward | Stations | Lowest | Ward median | Highest | Spread |
|---|---|---|---|---|---|
| Minato | 26 | ¥5,412 | ¥6,003 | ¥7,918 | +46% |
| Chiyoda | 18 | ¥5,313 | ¥5,817 | ¥6,983 | +31% |
| Shibuya | 18 | ¥4,564 | ¥5,613 | ¥6,427 | +41% |
| Chuo | 21 | ¥5,140 | ¥5,556 | ¥6,507 | +27% |
| Shinagawa | 26 | ¥4,469 | ¥5,294 | ¥6,192 | +39% |
| Shinjuku | 25 | ¥4,363 | ¥5,256 | ¥6,511 | +49% |
| Bunkyo | 14 | ¥4,256 | ¥5,076 | ¥5,896 | +39% |
| Taito | 12 | ¥4,410 | ¥5,043 | ¥5,751 | +30% |
| Koto | 19 | ¥3,813 | ¥5,022 | ¥5,616 | +47% |
| Meguro | 9 | ¥4,474 | ¥4,971 | ¥6,052 | +35% |
| Sumida | 15 | ¥3,767 | ¥4,859 | ¥5,234 | +39% |
| Toshima | 20 | ¥3,744 | ¥4,536 | ¥5,667 | +51% |
| Nakano | 12 | ¥3,427 | ¥4,310 | ¥4,944 | +44% |
| Ota | 33 | ¥3,333 | ¥4,277 | ¥4,916 | +47% |
| Setagaya | 36 | ¥2,933 | ¥4,103 | ¥5,035 | +72% |
| Arakawa | 18 | ¥3,333 | ¥4,085 | ¥4,634 | +39% |
| Kita | 16 | ¥3,526 | ¥3,956 | ¥4,357 | +24% |
| Itabashi | 20 | ¥3,131 | ¥3,902 | ¥4,458 | +42% |
| Suginami | 19 | ¥2,996 | ¥3,884 | ¥4,454 | +49% |
| Nerima | 19 | ¥3,096 | ¥3,579 | ¥4,079 | +32% |
| Katsushika | 12 | ¥3,021 | ¥3,438 | ¥4,095 | +36% |
| Adachi | 26 | ¥2,149 | ¥3,396 | ¥4,184 | +95% |
| Edogawa | 12 | ¥2,469 | ¥3,232 | ¥3,440 | +39% |
- Download the image PNG
- Download the numbers CSV, 446 rows
- Read the analysis
Source: <a href="https://www.tokyo-insights.com/tokyo-station-data#ward-station">Tokyo Insights</a> (CC BY 4.0)Walk time to the station
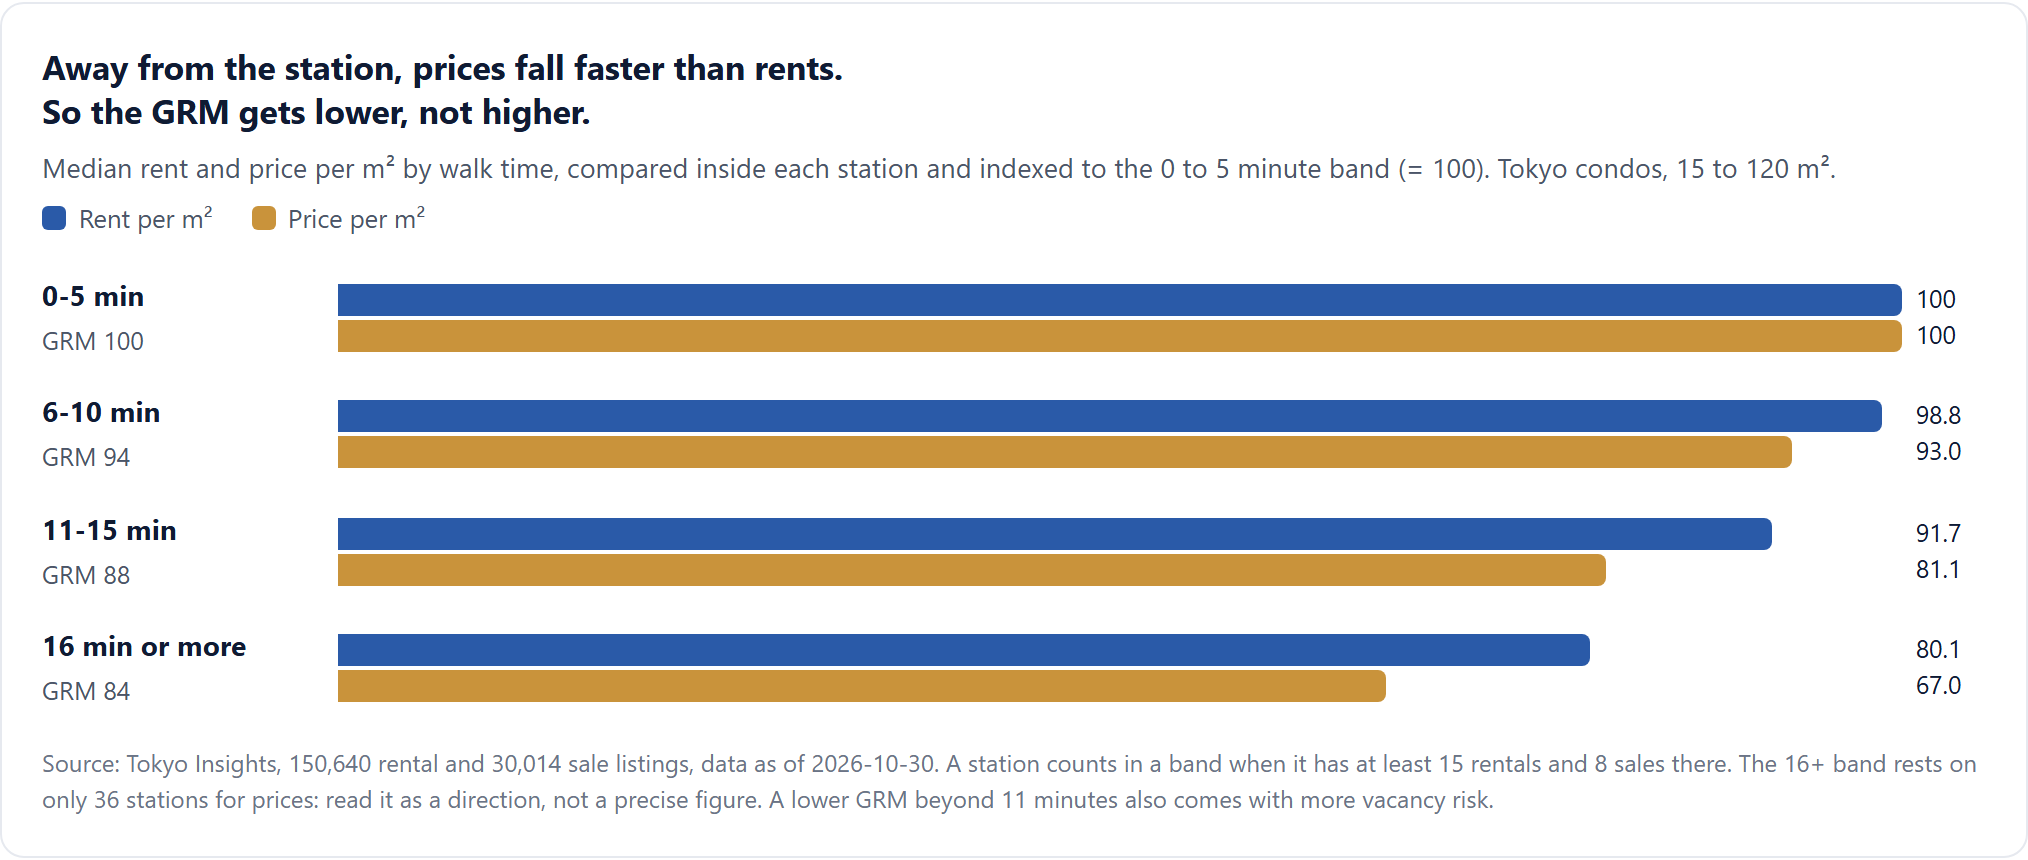
What each extra minute of walking does to rents and prices
Index by walk-time band, measured inside each station so that cheap and expensive areas do not mix. Prices fall faster than rents.
Source: Tokyo Insights, 150,640 rental and 30,014 sale listings, data as of 2026-10-30. A station counts in a band when it has at least 15 rentals and 8 sales there. The 16+ band rests on only 36 stations for prices: read it as a direction, not a precise figure. A lower GRM beyond 11 minutes also comes with more vacancy risk.
See the numbers
| Walk time | Rent index | Price index | GRM index | Stations (rent / price) |
|---|---|---|---|---|
| 0-5 min | 100 | 100 | 100 | 430 / 338 |
| 6-10 min | 98.8 | 93 | 94.1 | 395 / 275 |
| 11-15 min | 91.7 | 81.1 | 88.4 | 243 / 113 |
| 16 min or more | 80.1 | 67 | 83.6 | 86 / 36 |
- Download the image PNG
- Download the numbers CSV, 4 rows
- Read the analysis
Source: <a href="https://www.tokyo-insights.com/tokyo-station-data#walk-time">Tokyo Insights</a> (CC BY 4.0)Gross yield
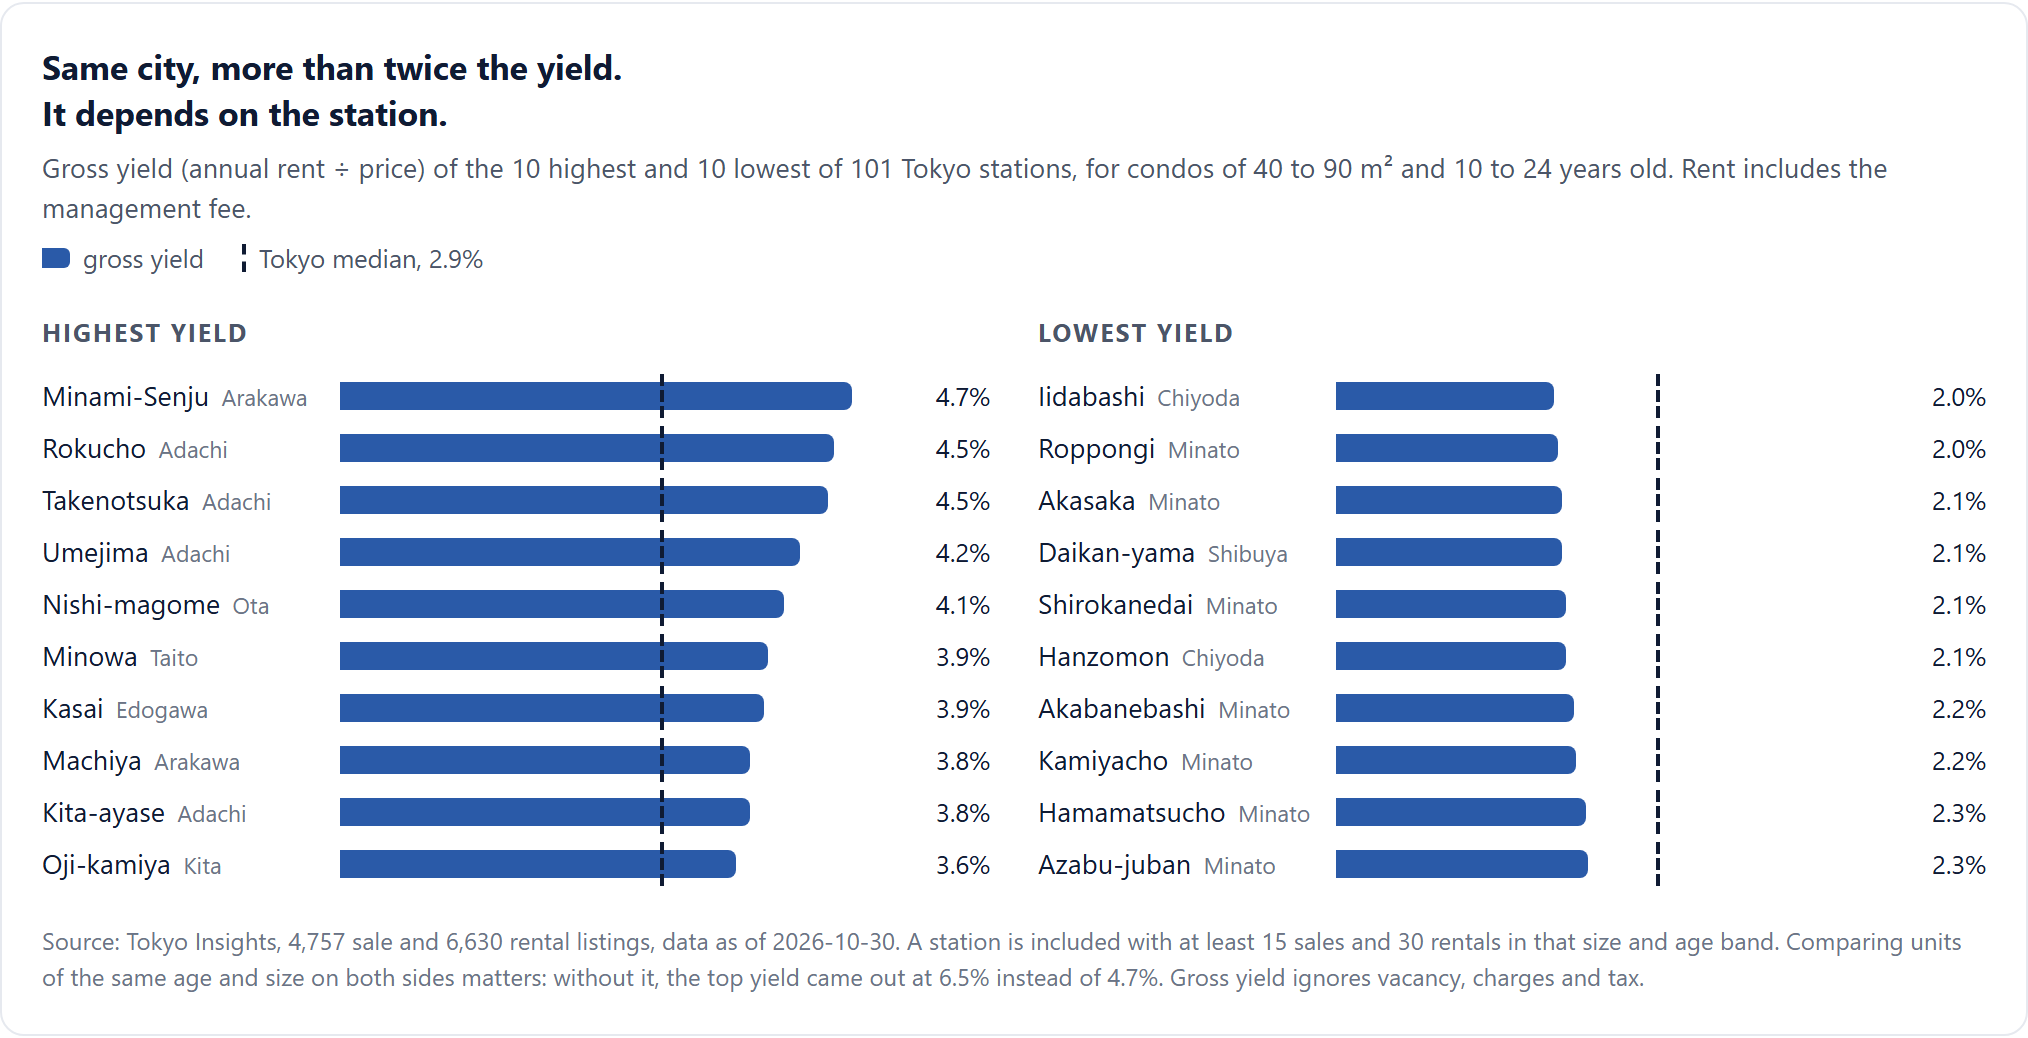
The 10 highest and 10 lowest gross yields in Tokyo
Gross yield by station for condos of the same size and age on the sale and rental side, so the comparison is fair.
Highest yield
Lowest yield
Source: Tokyo Insights, 4,757 sale and 6,630 rental listings, data as of 2026-10-30. A station is included with at least 15 sales and 30 rentals in that size and age band. Comparing units of the same age and size on both sides matters: without it, the top yield came out at 6.5% instead of 4.7%. Gross yield ignores vacancy, charges and tax.
- Download the image PNG
- Download the numbers CSV, 20 rows
- Read the analysis
Source: <a href="https://www.tokyo-insights.com/tokyo-station-data#station-yield">Tokyo Insights</a> (CC BY 4.0)Price, rent and GRM
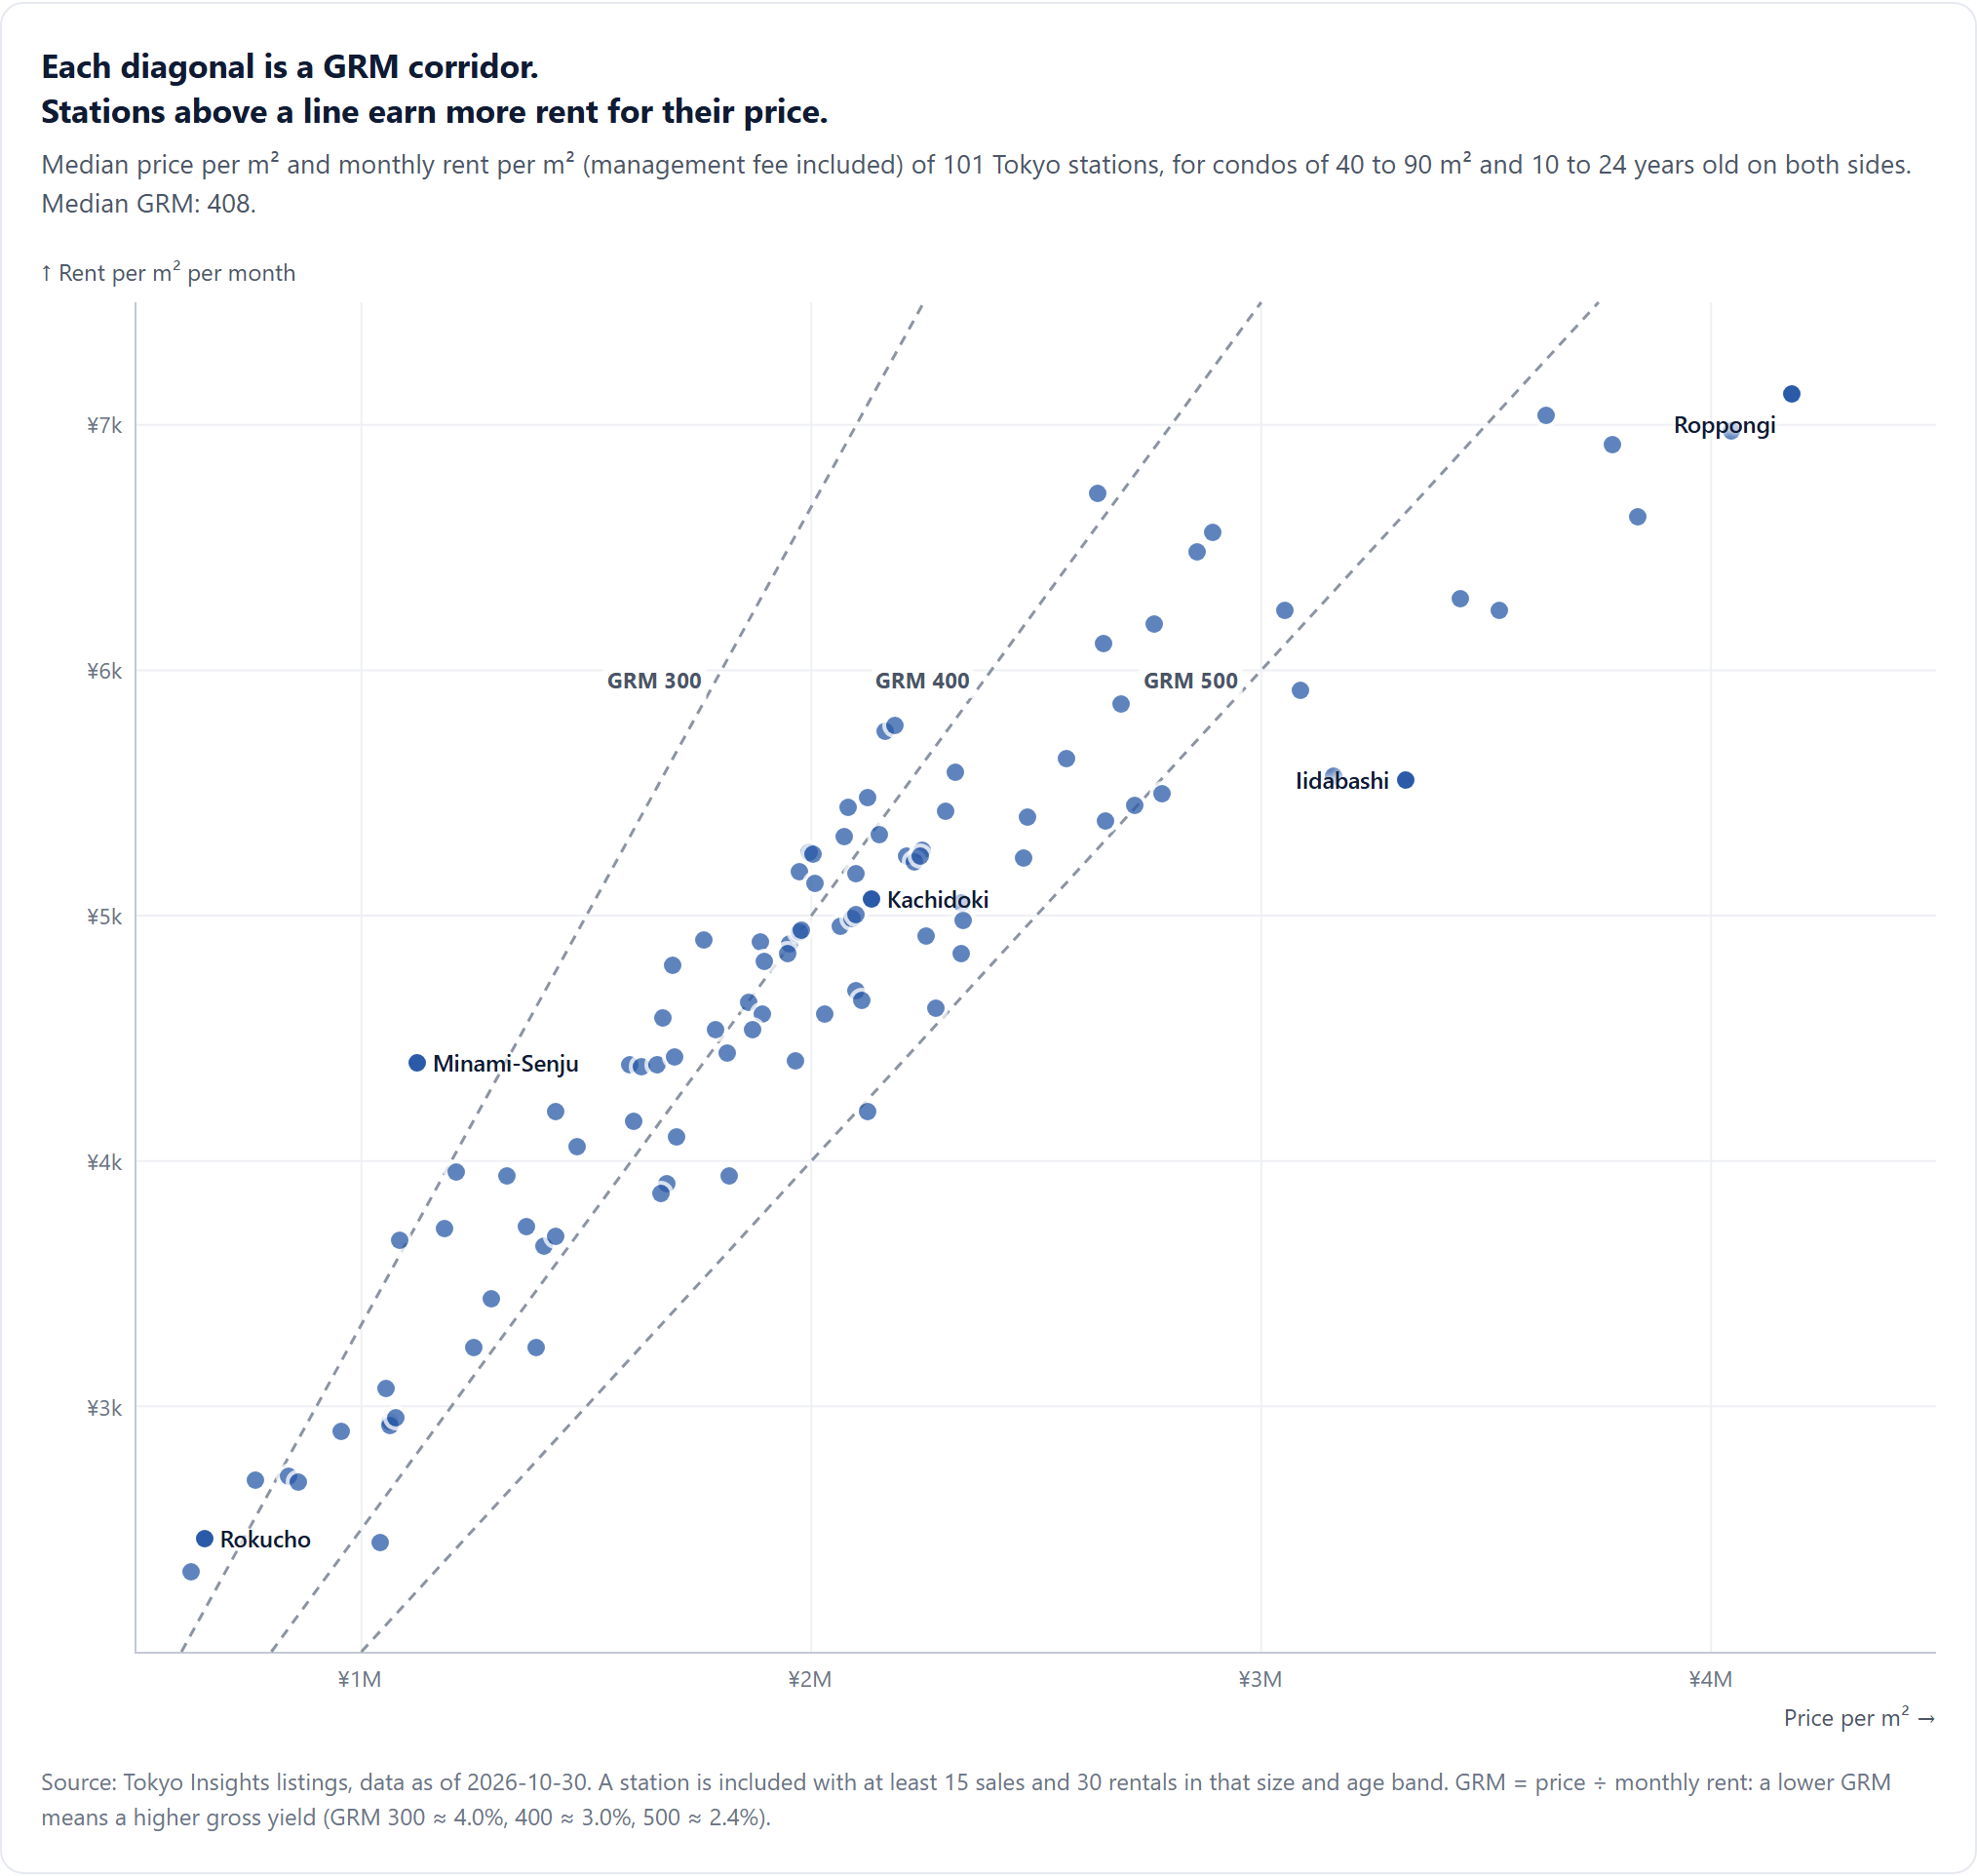
Price and rent per m² of 101 Tokyo stations
Each station placed by its price and its rent per m², with GRM bands (price ÷ monthly rent) to read the yield at a glance.
Source: Tokyo Insights listings, data as of 2026-10-30. A station is included with at least 15 sales and 30 rentals in that size and age band. GRM = price ÷ monthly rent: a lower GRM means a higher gross yield (GRM 300 ≈ 4.0%, 400 ≈ 3.0%, 500 ≈ 2.4%).
See all 101 stations, lowest GRM first
| Station | Ward | Price /m² | Rent /m² | GRM | Gross |
|---|---|---|---|---|---|
| Minami-Senju | Arakawa | ¥1.12M | ¥4,399 | 255 | 4.7% |
| Rokucho | Adachi | ¥0.65M | ¥2,463 | 264 | 4.5% |
| Takenotsuka | Adachi | ¥0.62M | ¥2,328 | 267 | 4.5% |
| Umejima | Adachi | ¥0.76M | ¥2,698 | 284 | 4.2% |
| Nishi-magome | Ota | ¥1.08M | ¥3,680 | 295 | 4.1% |
| Minowa | Taito | ¥1.21M | ¥3,961 | 306 | 3.9% |
| Kasai | Edogawa | ¥0.84M | ¥2,714 | 308 | 3.9% |
| Machiya | Arakawa | ¥1.19M | ¥3,726 | 318 | 3.8% |
| Kita-ayase | Adachi | ¥0.86M | ¥2,690 | 320 | 3.8% |
| Oji-kamiya | Kita | ¥0.96M | ¥2,898 | 330 | 3.6% |
| Chitose-Funabashi | Setagaya | ¥1.32M | ¥3,943 | 335 | 3.6% |
| Iriya | Taito | ¥1.43M | ¥4,204 | 341 | 3.5% |
| Chitose-karasuyama | Setagaya | ¥1.06M | ¥3,076 | 343 | 3.5% |
| Otsuka | Toshima | ¥1.69M | ¥4,801 | 353 | 3.4% |
| Shin-okachimachi | Taito | ¥1.76M | ¥4,901 | 359 | 3.3% |
| Funabori | Edogawa | ¥1.07M | ¥2,936 | 363 | 3.3% |
| Kuramae | Taito | ¥1.60M | ¥4,393 | 364 | 3.3% |
| Shin-Koiwa | Katsushika | ¥1.06M | ¥2,921 | 364 | 3.3% |
| Nakano-sakaue | Nakano | ¥1.67M | ¥4,587 | 364 | 3.3% |
| Nishiarai | Adachi | ¥1.08M | ¥2,955 | 365 | 3.3% |
| Tabata | Kita | ¥1.48M | ¥4,058 | 365 | 3.3% |
| Ogikubo | Suginami | ¥1.37M | ¥3,731 | 367 | 3.3% |
| Morishita | Koto | ¥1.62M | ¥4,385 | 370 | 3.2% |
| Nerima | Nerima | ¥1.29M | ¥3,442 | 374 | 3.2% |
| Meguro | Shinagawa | ¥2.16M | ¥5,750 | 376 | 3.2% |
| Shinagawa Seaside | Shinagawa | ¥1.66M | ¥4,398 | 377 | 3.2% |
| Gotanda | Shinagawa | ¥2.19M | ¥5,777 | 379 | 3.2% |
| Nishi-shinjuku | Shinjuku | ¥2.00M | ¥5,263 | 379 | 3.2% |
| Bakurochō | Chuo | ¥1.97M | ¥5,184 | 381 | 3.1% |
| Shinagawa | Minato | ¥2.00M | ¥5,255 | 381 | 3.1% |
| Shintomicho | Chuo | ¥2.08M | ¥5,444 | 382 | 3.1% |
| Ryogoku | Sumida | ¥1.69M | ¥4,427 | 383 | 3.1% |
| Tatsumi | Koto | ¥1.41M | ¥3,653 | 385 | 3.1% |
| Tennozu Isle | Shinagawa | ¥1.89M | ¥4,897 | 385 | 3.1% |
| Shakujii-kōen Station | Nerima | ¥1.25M | ¥3,242 | 385 | 3.1% |
| Nishi-sugamo | Toshima | ¥1.61M | ¥4,161 | 386 | 3.1% |
| Kodemmacho | Chuo | ¥2.12M | ¥5,483 | 388 | 3.1% |
| Kameido | Koto | ¥1.43M | ¥3,695 | 388 | 3.1% |
| Fudo-mae | Shinagawa | ¥2.07M | ¥5,323 | 390 | 3.1% |
| Suitengumae | Chuo | ¥2.01M | ¥5,136 | 391 | 3.1% |
| Omote-sando | Minato | ¥2.63M | ¥6,725 | 392 | 3.1% |
| Asakusabashi | Taito | ¥1.90M | ¥4,815 | 394 | 3.0% |
| Toritsu-daigaku | Meguro | ¥1.79M | ¥4,534 | 394 | 3.0% |
| Edogawabashi | Bunkyo | ¥1.95M | ¥4,889 | 399 | 3.0% |
| Ueno | Taito | ¥1.97M | ¥4,938 | 400 | 3.0% |
| Tsukishima | Chuo | ¥1.98M | ¥4,941 | 400 | 3.0% |
| Kinshicho | Sumida | ¥1.86M | ¥4,647 | 401 | 3.0% |
| Toyosu | Koto | ¥1.95M | ¥4,844 | 402 | 3.0% |
| Shinsen | Shibuya | ¥2.15M | ¥5,333 | 403 | 3.0% |
| Hatchōbori | Chuo | ¥2.10M | ¥5,174 | 406 | 3.0% |
| Nakano | Nakano | ¥1.81M | ¥4,440 | 408 | 2.9% |
| Higashi-nakano | Nakano | ¥1.89M | ¥4,603 | 411 | 2.9% |
| Gakugei-daigaku | Meguro | ¥1.87M | ¥4,535 | 412 | 2.9% |
| Asakusa | Taito | ¥1.70M | ¥4,102 | 414 | 2.9% |
| Tamachi | Minato | ¥2.32M | ¥5,583 | 416 | 2.9% |
| Higashi-nihombashi | Chuo | ¥2.07M | ¥4,955 | 417 | 2.9% |
| Hamacho | Chuo | ¥2.09M | ¥4,989 | 419 | 2.9% |
| Akihabara | Chiyoda | ¥2.10M | ¥5,003 | 419 | 2.9% |
| Kachidoki | Chuo | ¥2.13M | ¥5,070 | 421 | 2.9% |
| Akebonobashi | Shinjuku | ¥2.21M | ¥5,244 | 422 | 2.8% |
| Suidobashi | Chiyoda | ¥2.30M | ¥5,425 | 423 | 2.8% |
| Nishi-shinjuku-gochome | Shinjuku | ¥2.25M | ¥5,270 | 426 | 2.8% |
| Korakuen | Bunkyo | ¥2.23M | ¥5,223 | 427 | 2.8% |
| Koiwa | Edogawa | ¥1.04M | ¥2,445 | 427 | 2.8% |
| Yotsuya-sanchome | Shinjuku | ¥2.24M | ¥5,245 | 428 | 2.8% |
| Nishi-Ogikubo | Suginami | ¥1.39M | ¥3,244 | 428 | 2.8% |
| Yoga | Setagaya | ¥1.68M | ¥3,912 | 429 | 2.8% |
| Komazawa-daigaku | Setagaya | ¥1.66M | ¥3,870 | 430 | 2.8% |
| Hiro-o | Shibuya | ¥2.65M | ¥6,109 | 434 | 2.8% |
| Shibuya | Shibuya | ¥2.86M | ¥6,487 | 440 | 2.7% |
| Ebisu | Shibuya | ¥2.89M | ¥6,561 | 441 | 2.7% |
| Myogadani | Bunkyo | ¥2.03M | ¥4,600 | 441 | 2.7% |
| Sangen-jaya | Setagaya | ¥1.97M | ¥4,412 | 446 | 2.7% |
| Nogizaka | Minato | ¥2.76M | ¥6,190 | 446 | 2.7% |
| Hatsudai | Shibuya | ¥2.10M | ¥4,693 | 447 | 2.7% |
| Sengoku | Bunkyo | ¥2.11M | ¥4,657 | 454 | 2.6% |
| Shirokane-takanawa | Minato | ¥2.57M | ¥5,642 | 455 | 2.6% |
| Osaki | Shinagawa | ¥2.69M | ¥5,864 | 458 | 2.6% |
| Oimachi | Shinagawa | ¥2.26M | ¥4,915 | 459 | 2.6% |
| Tsukiji | Chuo | ¥2.48M | ¥5,405 | 459 | 2.6% |
| Sakura-shimmachi | Setagaya | ¥1.82M | ¥3,945 | 461 | 2.6% |
| Hongo-sanchome | Bunkyo | ¥2.33M | ¥5,051 | 462 | 2.6% |
| Kasuga | Bunkyo | ¥2.34M | ¥4,983 | 469 | 2.6% |
| Ningyōchō | Chuo | ¥2.47M | ¥5,234 | 472 | 2.5% |
| Ikebukuro | Toshima | ¥2.33M | ¥4,851 | 481 | 2.5% |
| Yoyogi | Shibuya | ¥3.05M | ¥6,245 | 489 | 2.5% |
| Takadanobaba | Shinjuku | ¥2.28M | ¥4,625 | 492 | 2.4% |
| Ikejiri-ohashi | Meguro | ¥2.65M | ¥5,386 | 493 | 2.4% |
| Naka-meguro | Meguro | ¥2.72M | ¥5,450 | 499 | 2.4% |
| Ichigaya | Chiyoda | ¥2.78M | ¥5,496 | 506 | 2.4% |
| Musashi-koyama | Shinagawa | ¥2.13M | ¥4,201 | 506 | 2.4% |
| Azabu-juban | Minato | ¥3.63M | ¥7,038 | 516 | 2.3% |
| Hamamatsucho | Minato | ¥3.09M | ¥5,922 | 522 | 2.3% |
| Kamiyacho | Minato | ¥3.78M | ¥6,919 | 547 | 2.2% |
| Akabanebashi | Minato | ¥3.44M | ¥6,293 | 547 | 2.2% |
| Hanzomon | Chiyoda | ¥3.53M | ¥6,243 | 566 | 2.1% |
| Shirokanedai | Minato | ¥3.16M | ¥5,569 | 567 | 2.1% |
| Daikan-yama | Shibuya | ¥3.84M | ¥6,625 | 579 | 2.1% |
| Akasaka | Minato | ¥4.05M | ¥6,979 | 580 | 2.1% |
| Roppongi | Minato | ¥4.18M | ¥7,130 | 586 | 2.0% |
| Iidabashi | Chiyoda | ¥3.32M | ¥5,556 | 598 | 2.0% |
- Download the image PNG
- Download the numbers CSV, 101 rows
- Read the analysis
Source: <a href="https://www.tokyo-insights.com/tokyo-station-data#station-grm">Tokyo Insights</a> (CC BY 4.0)Writing about Tokyo property?
Need a figure we don't show here?
Tell us what your piece is about and which station, ward or layout you need. If the data supports it, we will send you the figure with its sample size. Contact us.
Looking at one listing yourself?
The same data, applied to one condo: fair price, the rent it can earn and the red flags, in 48 hours.
Check a listing · $149